
Capital World’s MEASUREMENT OF INVESTMENT PERFORMANCE FOR TRANSPARENCY AND CONSISTENCY

It may come as a surprise to many that there are different ways to calculate investment returns and that it is possible to see a negative investment return for your portfolio when the underlying investments have actually generated positive returns.
How could this be? It all has to do with the calculation methodology that is used and the deposits or withdrawals into or out of the portfolio.
The two primary methods for calculating investment returns are:
- Money-weighted rate of return (MWRR) – also known as the dollar-weighted rate of return
- Time-weighted rate of return (TWRR)
In an effort to foster greater transparency and consistency in reporting across the industry, Canadian securities regulators implemented new rules and requirements a few years back. The changes included in phase 2 of what is known as the Client Relationship Model (CRM2) require firms to use the MWRR calculation method when reporting on the performance of a client’s portfolio. Many investment managers were not pleased with this requirement.
At CapitalWorld, we feel that it is the right decision as it provides investors with a more accurate picture of their performance; however, this reporting requirement does have its shortcomings.
In our quarterly client reports, we actually use both the MWRR and the TWRR calculations for performance reporting. First, we use the money-weighted methodology to inform clients of the. Returns that were earned by each of their accounts and their consolidated portfolio. And we show the performance of each of the investments owned within the portfolios. Using the time-weighted methodology provides a more accurate reflection of how the underlying investment managers performed. Excluding the impact of deposit or withdrawal decisions made by the investor. Our examples below will highlight the differences.
Examples of TWRR and MWRR Calculations
As we find it useful to use extreme examples to highlight a point, let’s assume that an investor has three separate investment accounts.
At the beginning of the year, she invests $100,000 into each account. And makes the exact same investment in each account. In the first 6 months, the underlying investment loses 20% and in the final 6 months of the year, the underlying investment rises by 35%.
Let’s also assume that the investor withdraws $30,000 from the first account and deposits $50,000 into the second account immediately after the first 6 months.
The table below provides an example of both the TWRR and the MWRR of each of these three accounts and the total of all three accounts over the 12 month period:
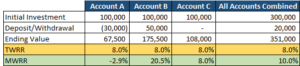
The TWRR is the same regardless of the deposits or withdrawals because it measures the underlying investment’s return.
However, the MWRR measures the investor’s performance. Accordingly, MWRR is heavily influenced by the dollar amount and timing of the deposits or withdrawals.
Account B, for example, had a significant deposit right before the investment rebounded. So it had more money benefiting from the rebound. The opposite occurred in Account A. And with no deposits or withdrawals, the MWRR for Account C was identical to the TWRR.
When using MWRR, it is much more difficult to compare the performance of various accounts.
So, when you are comparing your returns with friends or family. Keep in mind how much deposits and withdrawals can influence those returns!
Recommended Posts

Weekend Reading: Embracing Simplicity Edition
July 12, 2021

Weekend Reading: Best Offers Yet Edition
July 1, 2021

Weekend Reading: Unhealthy Housing Market Edition
June 18, 2021